CORA Live! Recap
CORA Live!
With our first year in the books, we decided to bring our CORA (City of Raleigh Analytics) online support community to our growing user base live. CORA Live! was a great opportunity to reflect on our progress over the past year, showcase 3 departments’ individual success stories and learn about some new and exciting things we have coming up. Below are some event highlights. Hope to see you again soon!
Our CIO Darnell Smith kicked things off with a thank you for our dedicated CORA community and a reminder that the use of analytics is helping to push the City to be a more data-driven community. We’re making a difference!
Next, I had the pleasure of communicating some of our great successes with the program in its first year. We have grown from 5 licenses of Power BI (PBI) in December 2017 to more than 270 today with an incredible amount of content created by both the EDM staff and most importantly you in the departments.

Next up were our department presentations. We heard from users who had been through our Power BI training program. They showed off their skills and accomplishments with real-life examples of their work. It’s clear that these data wizards are making a difference by fostering data-driven decision-making in their departments in a number of creative ways!
Here’s a little bit about each guest, and how they use PBI:.
- Laz Perez from Development Services brought us into the world of managing training hours and certifications through Power BI. He showed us how PBI’s ability to mash up data from multiple sources and simple interactive front end is making not only his job but many others in his department’ easier.
- Aditya Peri from Public Utilities showed us how PU combines GIS and location intelligence in PBI to assist in the management of assets. PU’s methodology of starting with the business question has really changed the way they use data. Also, PU has an internal CORA user group that focuses on the common methodology, data and tools being used to drive analysis for PU.
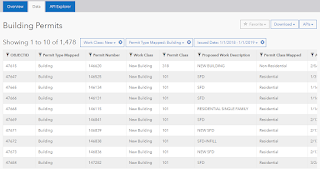
- Josh Powell from PR&CR also showcased the power for data mash-up in PBI by combining enterprise data from Class with extra information from Excel into a dynamic reporting application. This application is used by multiple levels of staff in PR&CR to more informed decisions on programming with in their locations.
We wrapped things up with a focus on the future of analytics in CORA. Now that we have an enterprise tool, it’s time to take a deeper dive into what we are producing. We will do that by following the Data, Visualization and Narrative (DVN) method: Take “good” data in the “right” visualization to tell the story or narrative which will drive use to transform data into information and then knowledge.

Future CORA Projects include:
- Continued enablement through education and mentoring
- Additional enterprise data sources
- New product\data feature videos
- Continuous improvement on governance and documentation.
Thank you so much for our group of CORA members who came out yesterday for our first CORA Live! event. If you couldn’t make it this time, we hope to see you at the next one!
DVN,
Bonnie
Comments
Post a Comment